
Financial statement
| Financial statement 2009 |
DKK. |
| National Budget Appropriation |
20.500.000 |
| Carried forward 2008 |
- |
| Reverse transfer 2009 |
1.082.685 |
| Total funding |
21.582.685 |
| Costs programme areas | |
| Architecture and Middleware |
1.702.000 |
| Information Supply |
1.092.000 |
| Meeting the User |
972.000 |
| New Institutions (incl. licences for the UVM-area of 800,000) |
|
| Contracts |
1.336.000 |
| Data well |
1.000.000 |
| Outside programme areas |
4.018.185 |
| Total costs programme areas |
12.711.685 |
| Operational costs | |
| Knowledge Exchange |
400.000 |
| Other expenses (conferences, travel, publications etc.) |
971.000 |
| Overhead to BM |
2.000.000 |
| Secretariat |
5.500.000 |
| Total operational costs |
8.871.000 |
| Total costs |
21.582.685 |
| To be carried forward to 2010 |
0 |
In 2009 the total National Budget Appropriation amounted to DKK 20.5 mil, of which about half was a subvention grant. The license activity is placed on a separate account and is expenditure neutral. In 2009 there was a further gain of about DKK 1 mil. which were reverse transfers from projects that had not used all their allocated means. The total hereafter amounted to about DKK 21.5 mil.
The subvention grant is placed under § 21.31.05. These means have all been allocated to projects. The grants are distributed by the steering committee on the basis of applications primarily from the programme groups.
Under ’contracts’ expenses in connection with operational contracts are included, which DEFF has entered into on behalf of the libraries. This applies to i.a. the running of The Danish National Research Database and a login-service. Under ’Outside programme areas’ are included i.a. expenses in connection with the Lime Guild report The Future of Research and the Research Library, expenses in connection with the work on strategy as well as a technical reserve of about DKK 1.5. mil for DEFF work in 2010.
License turnover pr year in DKK mil.
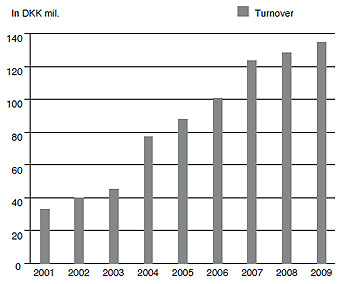
Figure 1: The figure shows the research libraries’ increasing
purchase of electronic resources via DEFF 2001-2009
Development of number of licenses and institutions
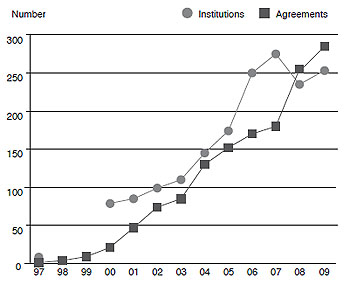
Figure 2: The figure illustrates an increase in number of institutions and
agreements over the past year. The drop shown in the graph of
institutions 2007-2008 is due to the mergers within
the university and university college area
| ![]() Forrige | Næste
Forrige | Næste ![]() | | Til sidens top |
| | Til sidens top |
This page is chapter 14 of 18 of the publication "Denmark´s Electronic Research Library, Annual Report 2009".
Publication may be found at the address http://www.bibliotekogmedier.dk/fileadmin/publikationer/publikationer_engelske/deff_annual_2009/index.htm
© 2010